miRDeep-P (miRDP) as a widely used tool for plant miRNA identification, has been developed for almost ten years, and in the last decade, it has been employed by word-wide users to identify miRNAs over 40 plant species. Even miRDP has achieved much success, with the development of NGS method, many new challenges arise. For instance, how to minimize the false-positive inheritable to computational predictions, and how to minimize the computational time required for analyzing the miRNA transcriptome in plants with complex and large genomes. Meanwhile, at the beginning of 2018, new plant miRNA criteria were released.
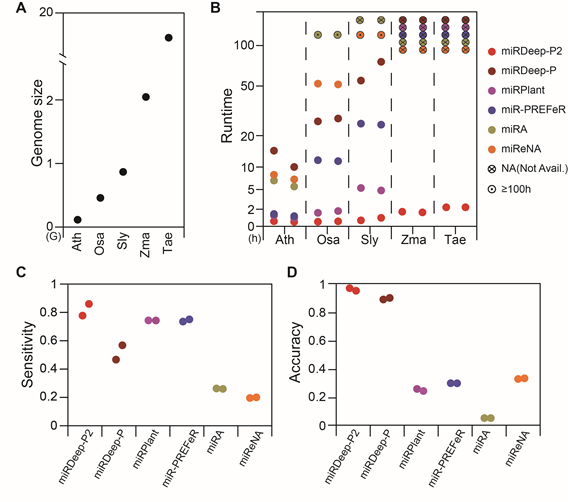
We updated miRDeep-P to miRDeep-P2 (miRDP2 for short) by employing a new filtering strategy and overhauling the algorithm. First, we tested miRDP2 against miRNA transcriptomes in plants with increasing genome sizes that included Arabidopsis, rice, tomato, maize and wheat. Compared with miRDeep-P and several other computational tools, miRDP2 processed NGS data with superior speed. By incorporating newly updated plant miRNA annotation criteria and developing a new scoring system, the accuracy of miRDP2 also outperformed other programs. The following figure detailed the advantages of miRDP2.

Performance of miRDP2. (A) Genome size (in Gb) of Arabidopsis thaliana (Ath), Oryza sativa (Osa), Solanum lycopersicum (Sly), Zea mays (Zma), Triticum aestivum (Tae). (B-D) Comparison of runtime, sensitivity and accuracy of miRDP2 and other five tools (details in Supplementary material 5).
The work on miRDP2 has been published in Bioinformatics.
Meanwhile, we adapted, combined and revised other available tools to handle and analyze all data with all standard we present in our database. The following are short descriptions on them.
Target prediction and validation. Two suites of plant miRNA target prediction methods, based on psRNATarget and RNAhybrid, were introduced to predict miRNA targets. The mature miRNA sequences and CDS sequences of corresponding species were uploaded to psRNATarget webserver. Newest default parameters of Schema V2 (2017 release) was used. The penalty for G:U pair, other mismatches, opening gap and extending gap were 0.5, 1, 2 and 0.5, respectively. The seed region was set to 2-13 nt with 1.5 extra weight and 2 allowed mismatches inside seed region. The length of region which will be scored complementarity between miRNAs and its targets was 19 nt. The position of slicing target sequences was set between 10-11 nt. Notably, the expectation threshold was decreased from 5 in default settings to 3 considering higher threshold would introduce many potential false positives. At the same time, the program RNAhybrid was used to predict energetically plausible miRNA:mRNA duplexes with plant-specific constraints as described previously, and a cut-off value for minimum free energy/minimum duplex energy of 0.70 was used. CleaveLand4 was used to process PARE-seq data, and to restrict the candidates are highly qualified, only items of category 0 and 1 were kept.
Expression analysis. The expression values of mature and star miRNAs were normalized by RPM (Reads Per Million). To each sRNA-Seq dataset, reads mapped to pri-miRNAs (mismatches not allowed) and localized in position of mature miRNAs (1-2 nt shift allowed) were deemed to reads corresponding to mature miRNAs. The total numbers of these reads were counted to calculate the RPM value of mature miRNAs. The same method was applied to achieve RPM values of star miRNAs. If there were multiple sRNA-Seq datasets from the same tissue, the mean of RPM values was presented in PmiRDB.
Syntenic analysis. The synteny analysis of miRNAs was carried out using MCScanX software, based on the previous description. Firstly, Gff file including all genes and MIRs, Fasta file including all CDS and MIRs were generated. Subsequently, we used local Blast software to compare whole sequences of each species with E-value less than 1e-10. The Gff file and Blast output files of all genes and MIRs were imported into MCScanX software to scan the collinearity MIRs pairs. Then Circos software was used to display the results of collinearity MIR pairs.
Conservation analysis. The conservation of miRNAs was assigned based on annotation results. For each annotated miRNA families, distribution of its members among all species were collected. The correspondence between miRNA families and their presented species were then highlighted in the species phylogenetic tree in miRNA detailed information page.